Dataism
“Scholarship will be strengthened if we are more open with research materials, yet we lack conventions and technical infrastructure for such openness.”1
This week, my failures really seemed to build on the contemplations of our readings. Not that our activities don’t typically relate to the activities we do, the relations just tend to be created upon the success I experience with the activities rather than the failures. Although, as I’ve written before, sometimes I feel that my greatest successes are the failures that help shape my understanding.
I had an unexpectedly busy week full of hastily made meetings, and when laying it all out on the calendar and to-do list apps I use to keep me sane, I realized I wouldn’t have as much time as usual to dedicate to this class so I wanted to get creative and make the activities I did count. The last module we did discussed the impact of data and by extension touched on how we might interpret it, and while these conversations mostly focused on ethics, it also made me start to consider the pedagogy of digital humanities– how are we actually taught the “technical” elements of our work such as cleaning data and creating visualizations? And how does this shape the data we produce and what it’s used for? The D’Ignazio & Klein article narrowed my thoughts on this topic in their deliberations over the misuse of data and importance of context, and so my thoughts shifted to the more specific questions of wondering how the environment this knowledge is created in effects it and how this might affect the ability of others to reproduce important findings. D’Ignazio & Klein talk about Big Dick Data in their article, and my mind immediately connected it to being a product of the attitude which has formed surrounding the usage of technology in the humanities– the notion that it’s how the fields under the umbrella of the humanities will “keep up with the times”, and that data created by these technologies is more accurate, factual, or unbiased than any human interpretation could be. Generated databases such as GDELT that flourish their interpretive capabilities which are backed by seemingly perfected algorithms that create the data contained within the database fall victim to data given without context. It is favoured due to the sheer mass of data it houses and it’s advertised potential, yet when used singularly, it loses the touch of human interpretation that can find errors a computer cannot parse or context that computer would not find at all from a poorly phrased headline. If someone used a database like GDELT to pull numbers from and produce graphs, then based their report on what these graphs tell them, would someone else writing a report on the same topic be able to replicate these findings even if they analyzed and cleaned the data before using it? Does this introduce a new layer of human bias, or help remove the bias that a generative digital tool may learn?
So that was basically a long way of saying that the first activity I decided to do was “Archaeologists Teaching Archaeologists”, following along with Ben Marwick & Matt Harris’s workshop introducing R to complete beginners for use in archaeological data analysis. I was curious to see how this might be taught by those not from a traditional “tech” background. At this point, I’m not a complete beginner in R; I’ve used it in both my digital humanities and HCI courses and, with and without the guidance of step-by-step tutorials such as the one featured in this activity. But regardless, there’s always more to learn so I started by launching the binder we were given and going through the tutorial via that route, and while I learned some new bits of information I couldn’t help but think of yet another line from D’Ignazio & Klein: “All knowledge is ‘situated’.” This line was referencing the necessity of context– knowing “the social, cultural, historical and material conditions in which that knowledge was produced, as well as the identities of the humans who made (or are making) that knowledge.” – but in my head, it was taking a different meaning. Knowledge can also be situated in the form that we learn it, so what happens when one tries to expand beyond that form, outside of space where one’s knowledge is rooted? So I decided to try running the workshop outside of binder, imagining I was a total novice trying to replicate what I learned in the workshop, now on my own machine. In general, things went pretty well, but I definitely still ran into some issues with certain functions now being depreciated on my updated system and certain packages not being installed on my system despite following the instructions as precisely as I could. Obviously, walking through this workshop was virtually effortless (ha) in the binder environment literally created for it, but I wonder about the effectiveness of tailored environments like this overall when it comes to replicability of work in digital humanities. When working in a pre-built environment like binder, everything is done with ease and makes you feel like “hey this isn’t so bad, I can definitely do this”– which I can wholeheartedly say is a good thing– but the typical lack of errors encountered in these types of tutorials can also be problematic when someone attempts to replicate what they were taught on their own device, encounters an error, isn’t sure what to do or how to parse it, and then decides that maybe the digital world just isn’t for them. Then there’s the issue of, if they try to search for answers, being met with a common issue I’ve found in tech: assumed knowledge and an explanation that might confuse someone just beginning to learn even more, which can be problematic in a largely self-taught field and result in the same end of abandoning their pursuit altogether. This sounds dramatic but I have a number of friends who have done just that– signing up for digital humanities courses and immediately dropping them after the first time they program and something goes wrong. The reproducibility of finalized data is important, but the ability to do so independently is important as well. Ultimately, giving context to the lesson is key, not only in reference to the data but also about the tools being used, what they’re doing, how things might go wrong, and how to fix this when it happens.
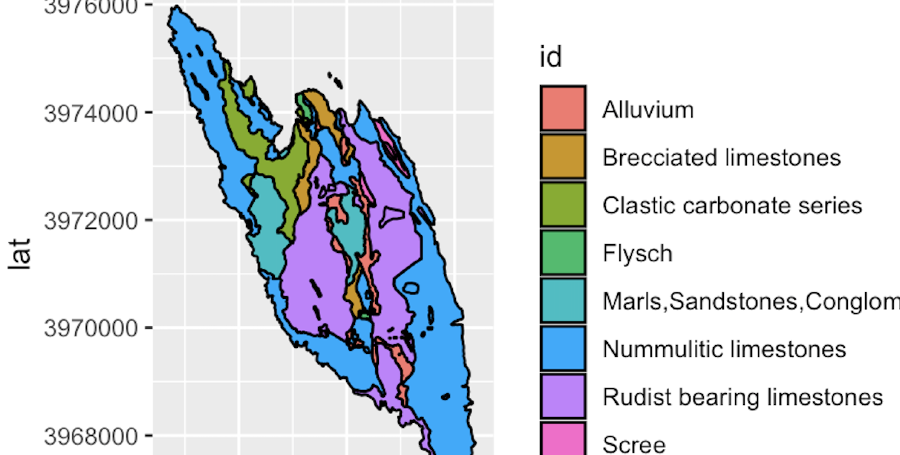
After this pedagogical tangent, I had philosophizing about how to teach replication, I moved on to my second activity for the week, which was looking at and visualizing data from the Archaeology Data Service. This is the activity that helped me truly grasp one of the lines from the Marwick, Boettiger & Mullen article: “Scholarship will be strengthened if we are more open with research materials, yet we lack conventions and technical infrastructure for such openness.” I took note of it because I honestly wasn’t entirely sure how to make sense of it– my thinking was that if open data is published on a seemingly “official” platform such as ADS, while their required conventions and infrastructure might not be universal, surely there would be some in place that all the data stored in this catalogue would follow.
The first thing that I discovered proving my initial thoughts on this topic wrong was when viewing the data that we used in the tutorial. I went over the table of glass artefacts and found nothing particularly unusual, but upon closer inspection after loading the table again for the next step, I noticed there were 2 categories under the name “vessel”, and the contents of these categories were identical except one populated where the other held “0” with “NA”. I wondered if these headers were actually meant to be separate or if the database glitched while being exported from whatever program was being used to create it causing a column to duplicate. I went to the ADS page for the data we loaded in search for answers about this… and found none. The introduction and background documents provided few details on the database’s contents, and the user guide wouldn’t load on any of my devices. I only had an image of the database relationship diagram, which was likely generated by the program used and thus contained the same (possible) category duplication. The greater struggle was yet to come, however, as the next part of this activity required me finding my own dataset from ADS to look at in R– R wasn’t the hard part, searching ADS was. Based on the URL of the database used in the first half of this activity, I determined that I wanted to be searching the ADS’s archives and that I was searching for a CSV that could be read into my program. Being both not an archaeologist and not familiar with the ADS, I didn’t know specifically what to look for so I started to browse results that interested me, only to discover that many collections just held reports and introductions rather than raw data. There seemed to be no way to browse for data beyond narrowing your topic down to a what, when, or where. After little luck finding a collection that actually had relevant raw data, I decided to look at the ADS help page to see if perhaps I was using the search wrong. Not only did I discover that ADS was not capable of searching for items at a file level, but I also found another disclaimer that stated that “the information and metadata held for the records within each of the search facilities are very different”, and thus accidentally learned that across their site, there is apparently little standardization. I did eventually find a dataset from the collection titled “The Sword in Early Medieval Northern Europe: Experience, Identity, Representation” which recorded “kennings”– linguistic constructions used in Old Norse and Old English poetry that replace simple nouns– on swords and related weaponry from literature that was created during this time period. The content was very interesting, but alas I noticed that certain categories used some shorthand I couldn’t understand, and when I turned to the documentation for this database, I discovered it was incomplete. There were explanations of each category in the tables and definition of shorthands for tables 1 & 2, but nothing for table 3– the data I was looking at.
My starting belief that the data contained in a database such as this would be clean, structured, and easy to use was undoubtedly proven to be untrue. ADS is an invaluable resource that gives huge amounts of data that would otherwise likely remain out of public eye a platform to be publically accessed and analyzed, which speaks to how scholarship could be strengthened if research materials are more openly available to use. Yet the catalogue remains scattered in how it organizes and regulates its massive collections, where data is placed, and what data must be included. It was actually stated in the introduction to the “Imported Material in Atlantic Britain and Ireland c.AD400-800” database that it is crucial for a user to read the user guide before working with their data to prevent misinterpretation and misuse, yet the guide was inexplicably inaccessible. Further, navigation of the database is hindered by a lack of consistency in metadata and a search structure that is unable to support the complexities of each database that the site hosts. Open data can and will continue to be used in this field, and it should be, because its all we have, but we also must consider the potential for harm when there are no standards widely put in place, and make creating this needed structure a priority so that the knowledge formed from these sources situate the data in any context necessary to prevent misrepresentation and false claims of indisputable conclusions.
1 Ben Marwick, Carl Boettiger & Lincoln Mullen. 2018. Packaging Data Analytical Work Reproducibly Using R (and Friends), The American Statistician, 72:1, 80-88.